- Home
- About
- Practice Areas
- Personal Injury Overview
- Car Accidents
- Bicycle Accidents
- Burn Injury
- Brain Injury
- Dog Bite
- Vibrio Vulnificus
- Infection from Saline Solution
- Motorcycle Accidents
- Pedestrian Accident
- Product Liability
- Scooter Accident
- Slip and Fall Accidents
- Spinal Cord Injury
- Underinsured Driver Accident
- Rideshare Accident
- Truck Accident
- Wrongful Death
- View All +
- Testimonials
- Results
- Resources
- Español
- Contact
Helping Colorado’s accident
victims for over 25 years.
victims for over 25 years.
60 Years of Traffic Safety Infographic
POSTED BY
October 11, 2010
Bicycle/Motorcycle Accidents
Car accidents
Pedestrian
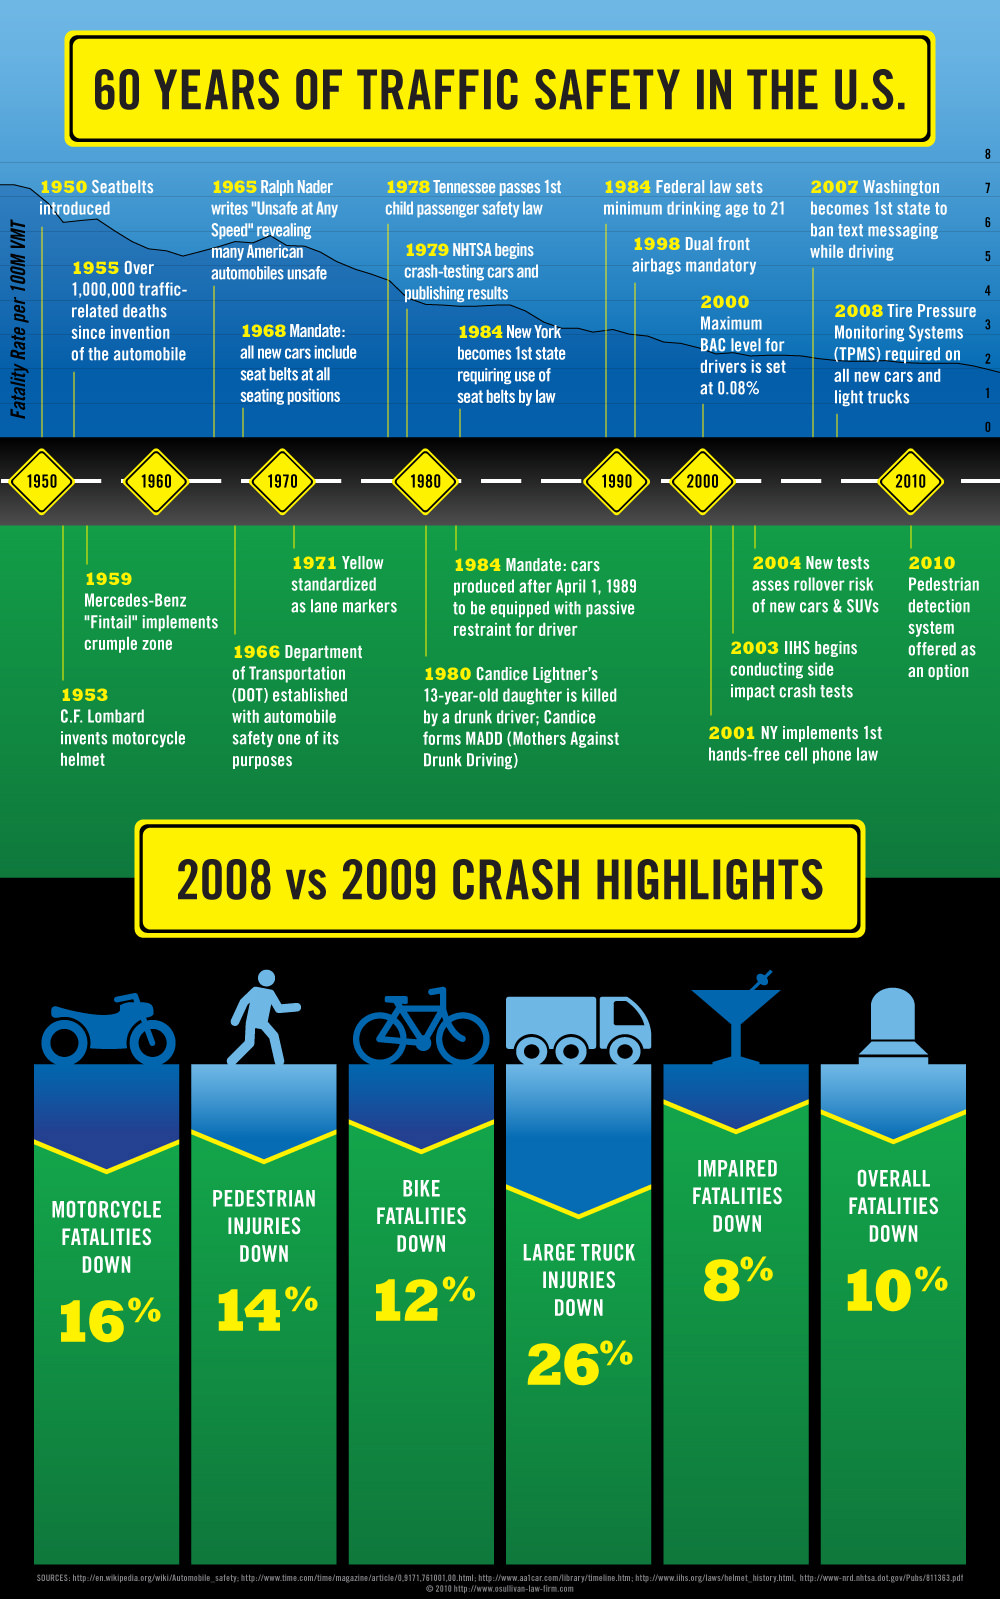
We’ve compiled a timeline of 60 years of traffic safety changes, with an infographic we put together based primarily on the NHTSA 60 year report on car accidents in the US that recently came out.
Traffic Laws Timeline
- 1950 Seatbelts introduced
- 1955 Over 1,000,000 traffic-related deaths since invention of the automobile
- 1959 Mercedes-Benz “Fintail” implements crumple zone
- 1965 Ralph Nader writes “Unsafe at Any Speed” revealing many American automobiles unsafe
- 1966 Department of Transportation (DOT) established with automobile safety one of its purposes
- 1968 Mandate: all new cars include seat belts at all seating positions
- 1971 Yellow standardized as lane markers
- 1978 Tennessee passes 1st child passenger safety law
- 1979 NHTSA begins crash-testing cars and publishing results
- 1980 Candice Lightner’s 13-year-old daughter is killed by a drunk driver; Candice forms MADD (Mothers Against Drunk Driving)
- 1984 Federal law sets minimum drinking age to 21
- 1984 New York becomes 1st state requiring use of seat belts by law at 0.08%
- 1984 Mandate: cars produced after April 1, 1989 to be equipped with passive restraint for driver
- 1984 Dual front airbags mandatory
- 1998 Dual front airbags mandatory
- 2000 Maximum BAC level for drivers is set
- 2001 NY implements 1st hands-free cell phone law
- 2003 IIHS begins conducting side impact crash tests
- 2004 New tests assess rollover risk of new cars & SUVs
- 2007 Washington becomes 1st state to ban text messaging while driving
- 2008 Tire Pressure Monitoring Systems (TPMS) required on all new cars and light trucks
- 2010 Pedestrian detection system offered as an option
2008 vs 2009 Crash Highlights
Motorcycle fatalities down 16%
Pedestrian injuries down 14%
Bike fatalities down 12%
Large truck injuries down 26%
Impaired fatalities down 8%
Overall fatalities down 10%