- Home
- About
- Practice Areas
- Personal Injury Overview
- Car Accidents
- Bicycle Accidents
- Burn Injury
- Brain Injury
- Dog Bite
- Vibrio Vulnificus
- Infection from Saline Solution
- Motorcycle Accidents
- Pedestrian Accident
- Product Liability
- Scooter Accident
- Slip and Fall Accidents
- Spinal Cord Injury
- Underinsured Driver Accident
- Rideshare Accident
- Truck Accident
- Wrongful Death
- View All +
- Testimonials
- Results
- Resources
- Español
- Contact
Helping Colorado’s accident
victims for over 25 years.
victims for over 25 years.
Motorcycle Accident Statistics: A Study of U.S. Fatal Crashes
POSTED BY
January 24, 2022
Motorcycle Accidents
Motorcycle riders often describe feeling an unparalleled sense of freedom when they are on their bike. For them, the exhilaration and spontaneity of the ride far outweigh the potential risks and dangers. But when motorcyclists are struck by larger passenger or commercial vehicles, the consequences are often catastrophic for the motorcyclist. In fact, for every mile traveled, the risk of a fatal crash is nearly 29 times greater for a motorcyclist than a passenger car occupant.
To get a full understanding of the risk that motorcyclists face, we analyzed 20 years of fatal crash data from the NHTSA. From 2000 – 2019, 86,998 people were killed in motorcycle crashes in the United States. 92 percent (79,883) of those killed were motorcyclists.
Fatal Motorcycle Accident Statistics: Key Findings
According to fatal crash data from the National Highway Traffic Safety Administration (NHTSA):
- During the observed time period, there were 84,038 fatal motorcycle crashes, killing 86,998 people.
- Motorcycles makeup three percent of registered vehicles and 0.6 percent of miles traveled, but are involved in 12 percent of all fatal motor vehicle crashes in the United States.
- Motorcycle deaths make up 11 percent of all roadway deaths.
- Motorcycle riders in fatal crashes are more likely to be male, middle-aged, and Caucasian, compared with drivers in other vehicles.
- Fatal motorcycle crashes are most likely to occur in clear weather, the daylight hours, and the summer months.
- Fatal motorcycle crashes are most likely to involve a moving vehicle (rather than fixed objects, like poles or walls).
- South Carolina is the state with the worst crash rate, and Minnesota is the state with the lowest crash rate.
- Daytona, Florida is the worst city for fatal motorcycle crashes, while Tampa, Florida is the worst large city (300,000 people or greater)
[Interactive Map] Every Fatal Motorcycle Crash from 2000 – 2019
Each point on this map represents one of the 84,038 fatal motorcycle crashes that occurred during the observed period. If you are viewing on a mobile device, please rotate for the optimal experience. Use the mouse wheel or touch gestures to zoom in and hover over any point to reveal more information about each crash.
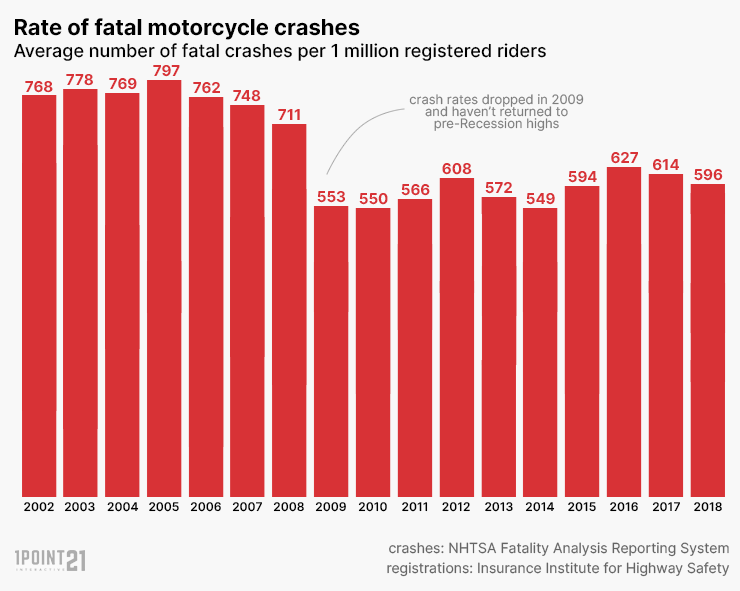
Rate of Fatal Motorcycle Crashes
- In 2005, the U.S. reached its highest rate of fatal motorcycle crashes (797 fatal crashes per 1 million registered riders).
- In 2009, crash rates dropped (to 553 fatal crashes per 1 million registered riders).
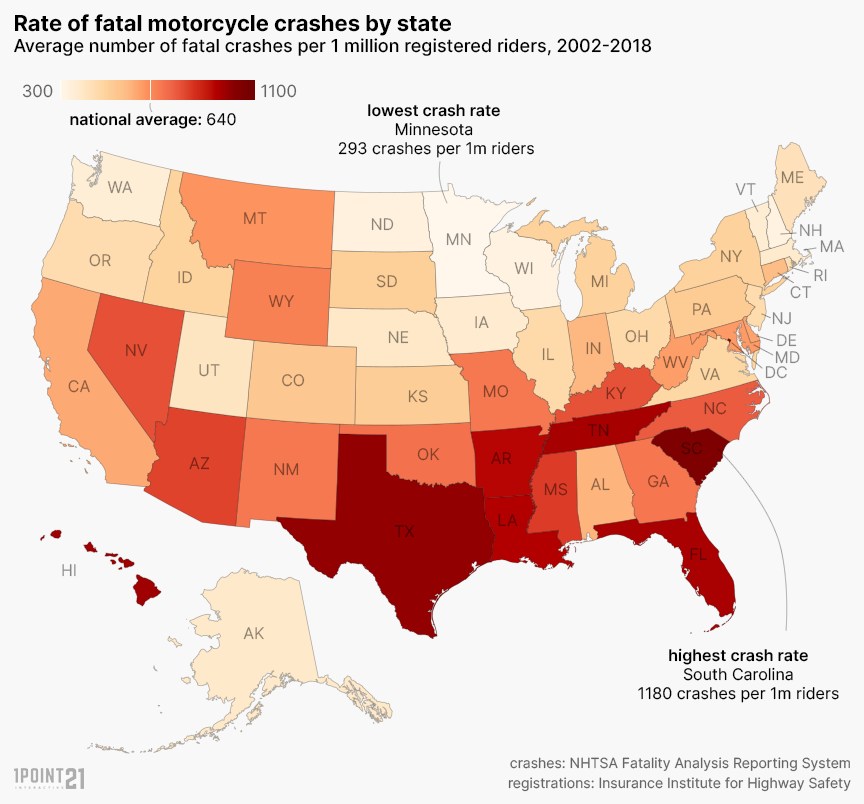
Where Do Crashes Occur?
Region and State
- The southern region of the U.S. has the highest motorcycle crash rate (per million registered riders).
- South Carolina is the state with the worst crash rate – 1,180 crashes per 1 million riders.
- Minnesota is the state with the lowest crash rate – 293 crashes per 1 million riders.
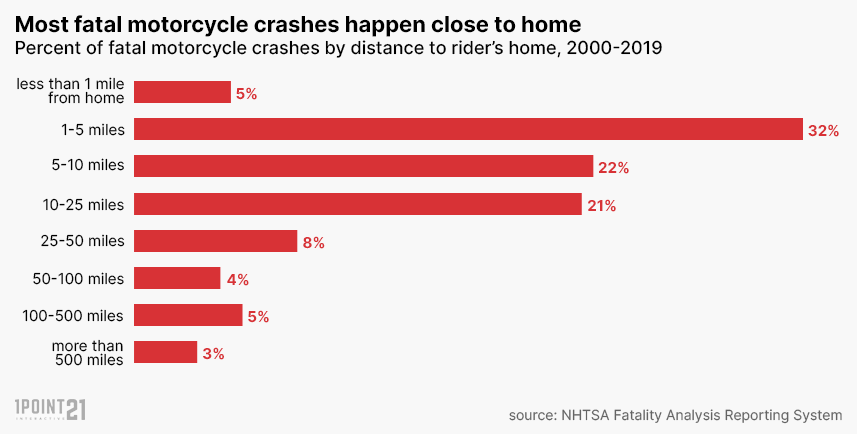
Distance From Home
- Fatal motorcycle crashes are likely to occur in close proximity to the motorcycle rider’s home.
- More than half of all fatal crashes (58 percent) occur within 10 miles of the rider’s home ZIP code.
- More than a third (37 percent) occur within 5 miles of home
- Five percent occur within just a mile of home.
Fatal Motorcycle Crashes by City
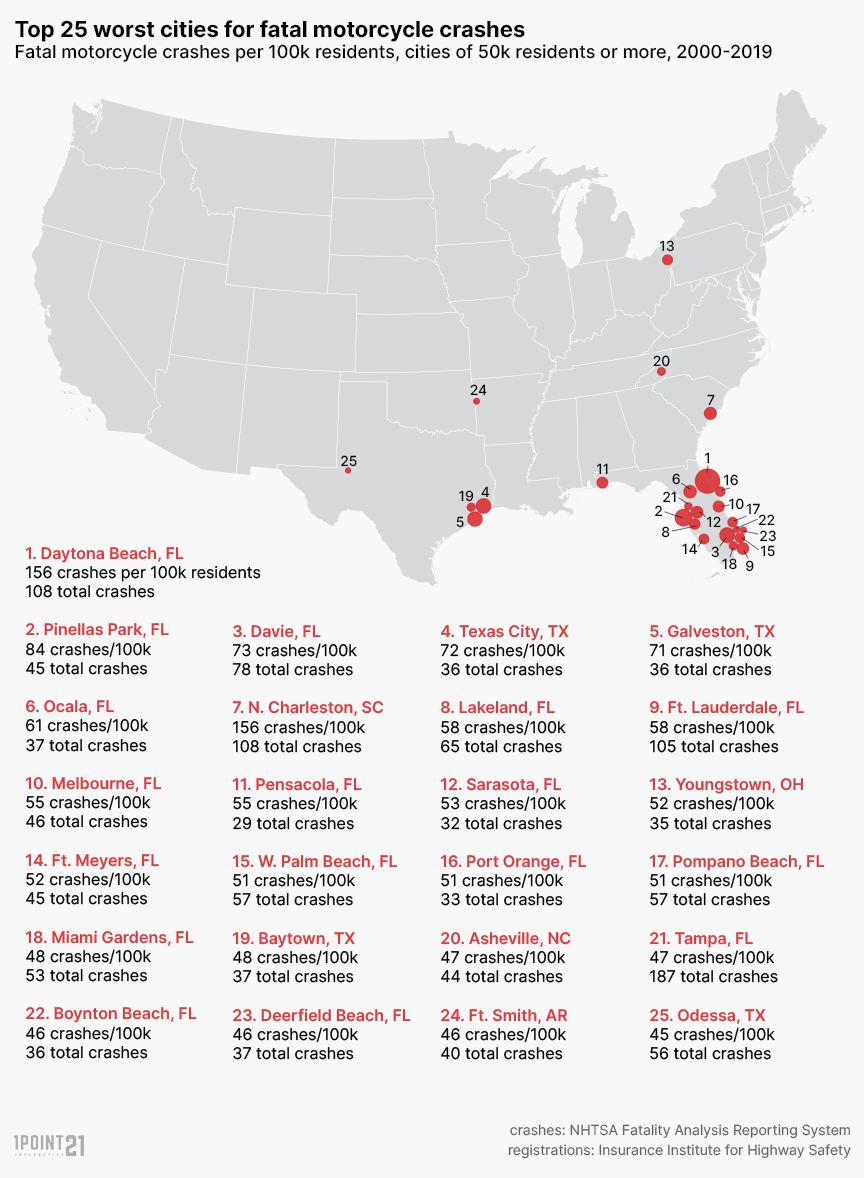
As shown on the map, the majority of hotspots – 17 out of 25 – are clustered in Florida. The rest are scattered across four cities in Texas, and one city in South Carolina, North Carolina, Ohio, and Arkansas.
Note that Florida has one of the largest numbers of registered motorcycles in the U.S and is also home to Daytona Beach Bike Week, the largest motorcycle event in the nation. This 10-day annual motorcycle event brings an estimated 500,000 people to the area. Motorcycle riders also have more opportunities to travel by bike on Florida’s open stretches of road and take advantage of the state’s year-round warm climate.
- Daytona Beach, Florida is the worst city for motorcycle crashes with a per-capita rate of crashes almost twice as high as the next city on the list (156 crashes per 100k residents vs. 84 crashes per 100k residents).
- Motorcycle crashes also make up 42 percent of all fatal crashes in Daytona Beach – the highest on the list (108/257).
- Also a beach city, Galveston, Texas, is the fifth worst city for motorcycle crashes with a per-capita rate of 71 crashes per 100k residents.
The 50 Worst Cities for Fatal Motorcycle Crashes
*With a population of at least 50,000, ranked by fatal motorcycle crashes per 100,000 residents.
| Rank | Name | State | Crashes per 100k | Crashes | Deaths | Percent Motorcycle |
|---|---|---|---|---|---|---|
| 1 | Daytona Beach | FL | 156.1 | 108 | 111 | 42% |
| 2 | Pinellas Park | FL | 83.9 | 45 | 45 | 29% |
| 3 | Davie | FL | 73.4 | 78 | 79 | 30% |
| 4 | Texas City | TX | 71.9 | 36 | 37 | 32% |
| 5 | Galveston | TX | 71.4 | 36 | 40 | 34% |
| 6 | Ocala | FL | 60.9 | 37 | 38 | 21% |
| 7 | North Charleston | SC | 58.9 | 68 | 69 | 29% |
| 8 | Lakeland | FL | 58 | 65 | 67 | 24% |
| 9 | Fort Lauderdale | FL | 57.6 | 105 | 106 | 24% |
| 10 | Melbourne | FL | 55.4 | 46 | 46 | 32% |
| 11 | Pensacola | FL | 54.7 | 29 | 29 | 27% |
| 12 | Sarasota | FL | 53.2 | 31 | 32 | 23% |
| 13 | Youngstown | OH | 51.9 | 34 | 35 | 26% |
| 14 | Fort Myers | FL | 51.7 | 45 | 46 | 20% |
| 15 | West Palm Beach | FL | 50.9 | 57 | 59 | 21% |
| 16 | Port Orange | FL | 50.9 | 33 | 33 | 40% |
| 17 | Pompano Beach | FL | 50.8 | 57 | 60 | 22% |
| 18 | Miami Gardens | FL | 48.2 | 53 | 54 | 22% |
| 19 | Baytown | TX | 47.9 | 37 | 38 | 20% |
| 20 | Asheville | NC | 47.4 | 44 | 44 | 21% |
| 21 | Tampa | FL | 46.8 | 187 | 192 | 24% |
| 22 | Boynton Beach | FL | 45.8 | 36 | 39 | 23% |
| 23 | Deerfield Beach | FL | 45.6 | 37 | 37 | 24% |
| 24 | Fort Smith | AR | 45.5 | 40 | 41 | 33% |
| 25 | Odessa | TX | 45.4 | 56 | 58 | 22% |
| 26 | Clearwater | FL | 45.3 | 53 | 56 | 25% |
| 27 | St. Petersburg | FL | 45.2 | 120 | 121 | 23% |
| 28 | Kingsport | TN | 44.3 | 24 | 24 | 16% |
| 29 | Killeen | TX | 43.5 | 66 | 67 | 39% |
| 30 | Lake Elsinore | CA | 43.3 | 30 | 30 | 27% |
| 31 | Boca Raton | FL | 43.1 | 43 | 43 | 21% |
| 32 | Palm Coast | FL | 42.3 | 38 | 41 | 29% |
| 33 | New Orleans | LA | 41.3 | 161 | 163 | 25% |
| 34 | Birmingham | AL | 41.1 | 86 | 87 | 15% |
| 35 | Greenville | SC | 41.1 | 29 | 30 | 23% |
| 36 | Grand Junction | CO | 40.9 | 26 | 27 | 26% |
| 37 | Kansas City | KS | 40.5 | 62 | 65 | 23% |
| 38 | Hammond | IN | 39.7 | 30 | 31 | 24% |
| 39 | Abilene | TX | 39.7 | 49 | 51 | 23% |
| 40 | Hollywood | FL | 39.4 | 61 | 61 | 22% |
| 41 | Orlando | FL | 39.3 | 113 | 124 | 21% |
| 42 | Jacksonville | FL | 39.2 | 357 | 363 | 19% |
| 43 | Amarillo | TX | 39.1 | 78 | 84 | 23% |
| 44 | Sanford | FL | 39.1 | 24 | 26 | 20% |
| 45 | Palm Bay | FL | 38.9 | 45 | 49 | 33% |
| 46 | Anderson | IN | 38.3 | 21 | 22 | 25% |
| 47 | Fayetteville | NC | 38.3 | 81 | 84 | 22% |
| 48 | Hartford | CT | 37.7 | 46 | 47 | 24% |
| 49 | Chattanooga | TN | 37.2 | 68 | 72 | 17% |
| 50 | Kissimmee | FL | 37.1 | 27 | 27 | 24% |
The 25 Worst Big Cities for Fatal Motorcycle Crashes
Only three large cities made the top 50 list – Tampa, New Orleans, and Jacksonville. If we limit our list to cities to cities with at least 300,000 residents, the list looks much different.
| Rank | Name | State | Crashes per 100k | Crashes | Deaths | Percent Motorcycle |
|---|---|---|---|---|---|---|
| 1 | Tampa | FL | 46.78 | 187 | 192 | 24% |
| 2 | New Orleans | LA | 41.26 | 161 | 163 | 25% |
| 3 | Jacksonville | FL | 39.16 | 357 | 363 | 19% |
| 4 | Tulsa | OK | 36.14 | 145 | 148 | 20% |
| 5 | Miami | FL | 35.25 | 165 | 170 | 21% |
| 6 | Oklahoma City | OK | 34.95 | 229 | 234 | 21% |
| 7 | Detroit | MI | 33.58 | 225 | 230 | 13% |
| 8 | Memphis | TN | 32.40 | 211 | 221 | 14% |
| 9 | Cleveland | OH | 31.49 | 120 | 125 | 23% |
| 10 | Phoenix | AZ | 30.51 | 513 | 526 | 17% |
| 11 | Albuquerque | NM | 30.15 | 169 | 176 | 22% |
| 12 | Kansas City | MO | 29.87 | 148 | 152 | 15% |
| 13 | St. Louis | MO | 29.27 | 88 | 89 | 12% |
| 14 | Wichita | KS | 27.44 | 107 | 112 | 22% |
| 15 | Honolulu | HI | 26.66 | 92 | 94 | 29% |
| 16 | Houston | TX | 26.63 | 618 | 631 | 15% |
| 17 | Tucson | AZ | 26.27 | 144 | 147 | 17% |
| 18 | Nashville-Davidson | TN | 25.93 | 174 | 176 | 15% |
| 19 | Atlanta | GA | 25.84 | 131 | 133 | 15% |
| 20 | Indianapolis city | IN | 25.44 | 223 | 233 | 18% |
| 21 | Las Vegas | NV | 24.87 | 162 | 163 | 21% |
| 22 | Corpus Christi | TX | 24.80 | 81 | 83 | 20% |
| 23 | Dallas | TX | 24.71 | 332 | 339 | 13% |
| 24 | Colorado Springs | CO | 23.83 | 114 | 120 | 29% |
| 25 | Mesa | AZ | 22.39 | 116 | 118 | 20% |
Who Is Most Likely to Be in a Crash?
Compared with drivers in other vehicles, motorcycle riders in fatal crashes are more likely to be male, Caucasian, and middle-aged.
- 96 percent of motorcycle riders in fatal crashes are male (compared with 69 percent of male drivers of other vehicles).
- From 2009 to 2018, between 10-19 percent of motorcycle owners were women. However, even as more women purchase and own motorcycles, the rate of deaths for men remains significantly higher than that of women.
- 87 percent of motorcycle riders killed in a crash were Caucasian (compared with 84 percent of Caucasian drivers in other vehicles).
- Motorcycle riders in fatal crashes are much less likely to be African American, Native American, or Asian than drivers in other types of vehicles.
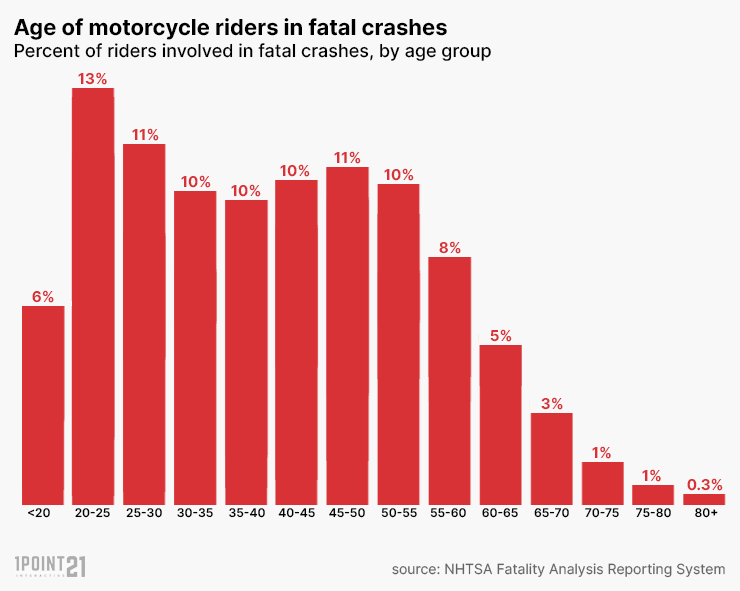
- Motorcycle riders in fatal crashes are most commonly 20-25 years old.
- However, when compared to drivers in other types of vehicles, riders are 33 percent more likely to be between the ages of 40 and 60.
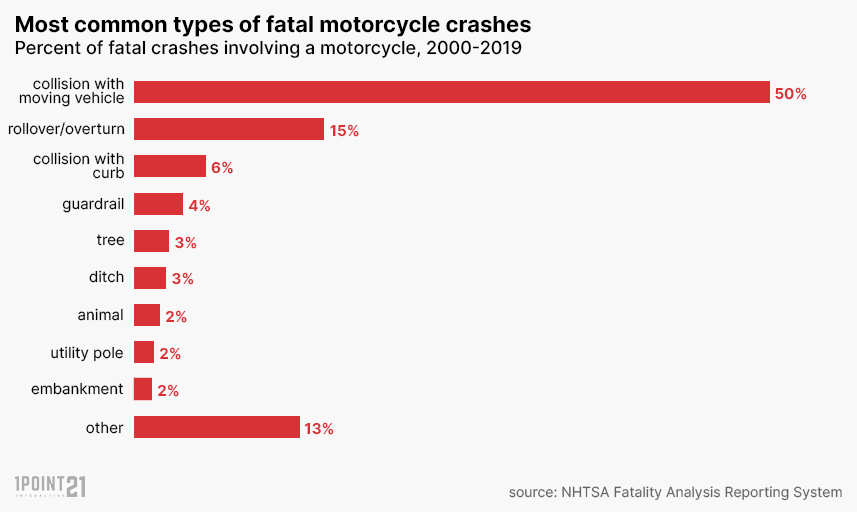
What Types of Crashes Are the Most Common?
Motorcycle crashes are most likely to involve another moving vehicle, such as a passenger car or a commercial truck.
- Half of all crashes over the last two decades were collisions with moving vehicles.
- 15 percent of crashes occur when a motorcycle overturns or flips over.
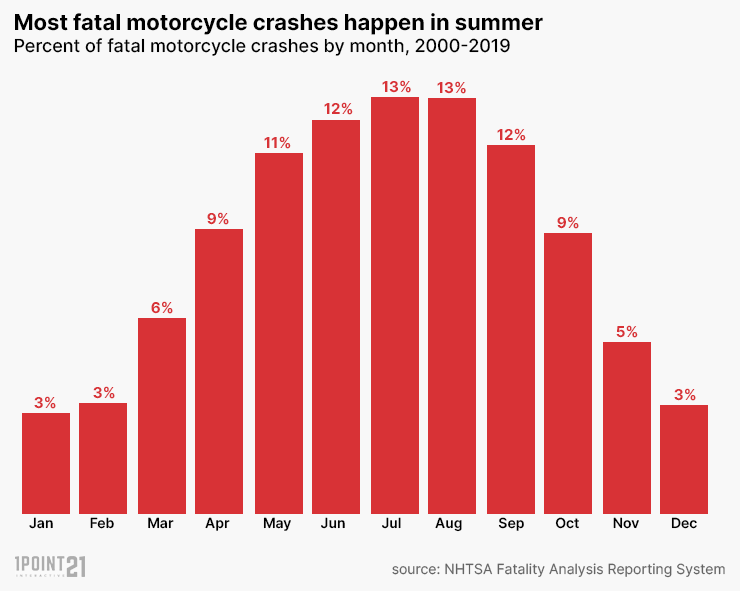
When Do Crashes Occur?
Fatal motorcycle crashes most commonly occur during clear days, daylight hours, and summer months – when motorcycle riders are most likely to be on the roads. 61 percent of all fatal motorcycle crashes were between May and September.
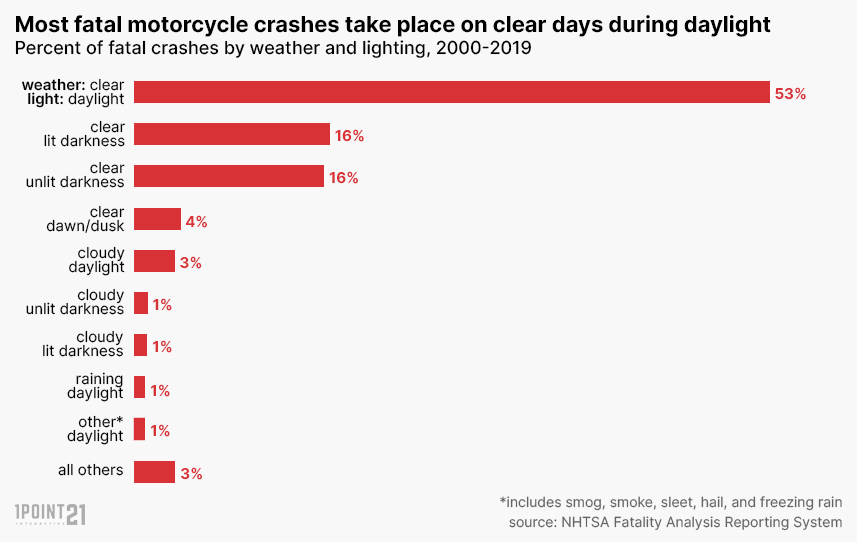
Weather and Visibility Conditions
Most fatal motorcycle crashes take place in relatively good weather with good visibility. In fact, 53 percent of all fatal motorcycle crashes happened when the weather was clear and there was still daylight outside.
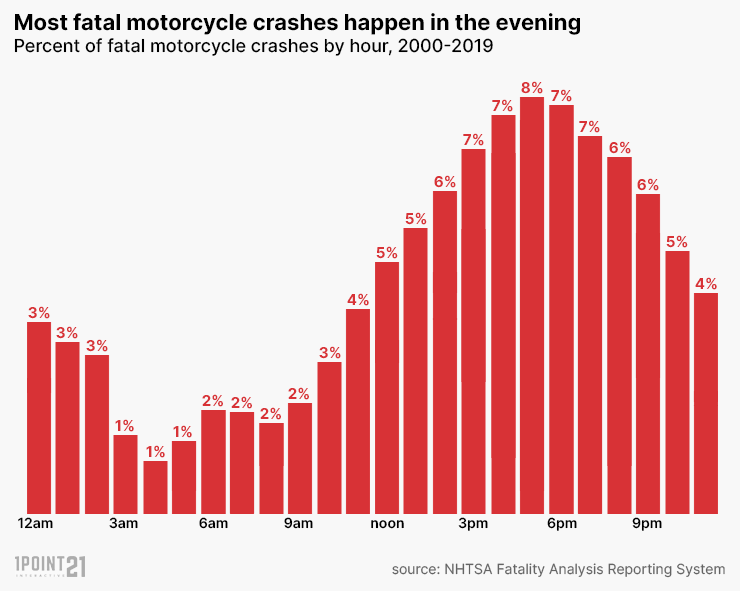
Time of Day
Most fatal motorcycle crashes occur in the early evening. While crashes begin to rise at noon, they peak at 5 p.m. and begin to decrease later in the evening.
Why Do Crashes Occur?
Alcohol-Related
Nearly a third of motorcycle riders had some level of alcohol in their system at the time of their crash – which is significantly higher than drivers of other types of vehicles.
- 24 percent of motorcycle riders in fatal crashes had a blood alcohol concentration (BAC) above the legal limit.
- Eight percent were buzzed (BAC between 0.01 and 0.08).
Helmet Use
- 42 percent of motorcycle riders in fatal crashes were not wearing helmets.
- When surveyed between 2001-2018, an average of 39 percent of the motorcycle riders confessed to not wearing helmets. This number dropped closer to 30 percent in recent years.
- In general, motorcycle riders that do not wear helmets are at higher risk of death than those who do. In 2020, 40% of the 5,579 motorcyclists killed nationally were not wearing a helmet during the fatal crash.
- Helmets are estimated to be 37 percent effective in preventing fatalities for motorcycle riders and 41 percent for motorcycle passengers. This means that for every 100 unhelmeted motorcycle riders killed in crashes, 37 of them could have been saved had all 100 worn helmets.

Speed
- Speed was a factor in 36 percent of fatal motorcycle crashes.
Experience/Licensing
- About 26 percent of motorcycle riders did not have a valid license at the time of the crash.
Compared to licensed motorcycle riders, unlicensed cyclists in fatal crashes are:
- Younger (average 35 years vs. 43 years)
- More likely to be male (98 percent vs. 96 percent)
- More likely to be drunk (30 percent vs. 22 percent) or buzzed (8 percent vs. 6 percent)
- More likely to not be wearing a helmet (47 percent vs. 40 percent)
- More likely to be speeding (44 percent vs. 32 percent)
Preventing Motorcycle Accidents
Motorcycle road safety is everyone’s responsibility. Whether it be the motorcycle rider or the other passenger or commercial vehicles around them, there are several steps that all road users can take to keep motorcyclists and other motorists safe.
As a driver of another vehicle:
- Maintain a safe distance when driving behind a motorcycle.
- Give motorcycle riders room when passing them.
- Pay extra attention to motorcycle riders at intersections, when making a left turn, or when changing lanes.
As a rider:
- Wear high-visibility reflective riding gear (including helmets, jackets, vests, gloves), especially at night. Check out these brands.
- Avoid riding in the blind spots of other vehicles.
- Add LED lights or other lights to your motorcycle.
Data Sources
This study is based on 2000-2019 motorcycle fatal crash data from the National Highway Traffic Safety Administration (NHTSA).
If you would like to report or republish our findings, please link to this page to provide a citation for our work.