- Home
- About
- Practice Areas
- Personal Injury Overview
- Car Accidents
- Bicycle Accidents
- Burn Injury
- Brain Injury
- Dog Bite
- Vibrio Vulnificus
- Infection from Saline Solution
- Motorcycle Accidents
- Pedestrian Accident
- Product Liability
- Scooter Accident
- Slip and Fall Accidents
- Spinal Cord Injury
- Underinsured Driver Accident
- Rideshare Accident
- Truck Accident
- Wrongful Death
- View All +
- Testimonials
- Results
- Resources
- Español
- Contact
Helping Colorado’s accident
victims for over 25 years.
victims for over 25 years.
Why We Created the Denver Accident Map
POSTED BY
May 17, 2018
Car accidents
Safety
I live in Denver, and I’ve lived here a long time. And, as anyone who has lived here for more than five years can attest: traffic is getting nuts! It feels like Denver’s streets are getting more dangerous by the day. But, aside from weekday morning traffic reports, it can be hard to determine how dangerous and where the car crash hot-spots are. I wanted a way to view car accidents in Denver by type and location so that I could make better, safer decisions about my typical travel routes. (Not to mention the fact that I will soon have a teenage driver and I want to prepare him with as much information as possible to keep him safe, as well.)
As luck would have it, my brother-in-law, Andrew Russette, is a super data nerd (he won’t mind me calling him that) and he said he knew a way that we could map Denver’s car crashes!
Building the Map

Using the Denver Open Data Catalog, Andy was able to access traffic accident statistics that the city of Denver updates every night.
(Aside: The Open Data movement was born in December 2007 and its inception and growth are fascinating. The movement is founded on eight simple principles — that data should be complete, primary, timely, accessible, machine-processable, nondiscriminatory, nonproprietary and license-free. Taking that one step further: Andy and I believe that the programs which are created to crunch and analyze that open data – such as our Denver Car Crash Map – should make the data easily digestible for the “average joe” and should be non-proprietary. But our philosophy is not shared by all. I encourage you to read more about the movement here. You might also enjoy this book: Open Government Data: The Book.)
Now, back to our regularly scheduled programming…
Andy began working diligently on a program that could pull data from the Denver Open Data Catalog and use it to illustrate the story of Denver’s car crashes on a map. Over the course of this process, we had to make some decisions about how to share the data.
For example:
The Denver Open Data Catalog includes traffic accident data from police records for the city of Denver. Categories include:
- traffic accident (no injuries);
- traffic accident DUI or DUID;
- traffic accident with a fatality;
- hit and run;
- traffic accident involving police vehicles;
- traffic accident involving serious bodily injury;
- traffic accident involving a bicycle; and
- traffic accident involving pedestrians.
However…
- Denver does not break traffic accidents into subcategories of vehicle type. For example, a motorcycle crashing into a pole would be classified as a traffic accident.
And…
- The hit and run data from Denver does not delineate whether the car hits another car or a pedestrian.
Therefore, in making our own priorities for our map, we specifically extracted data including pedestrians or bicyclists so that we could make them their own categories. We wanted to know where people are getting hit on Denver’s streets. Therefore, if any type of car crash involved a pedestrian, for example, it shows up on the map as “Pedestrian Involved.”
Dynamic Car Crash Data
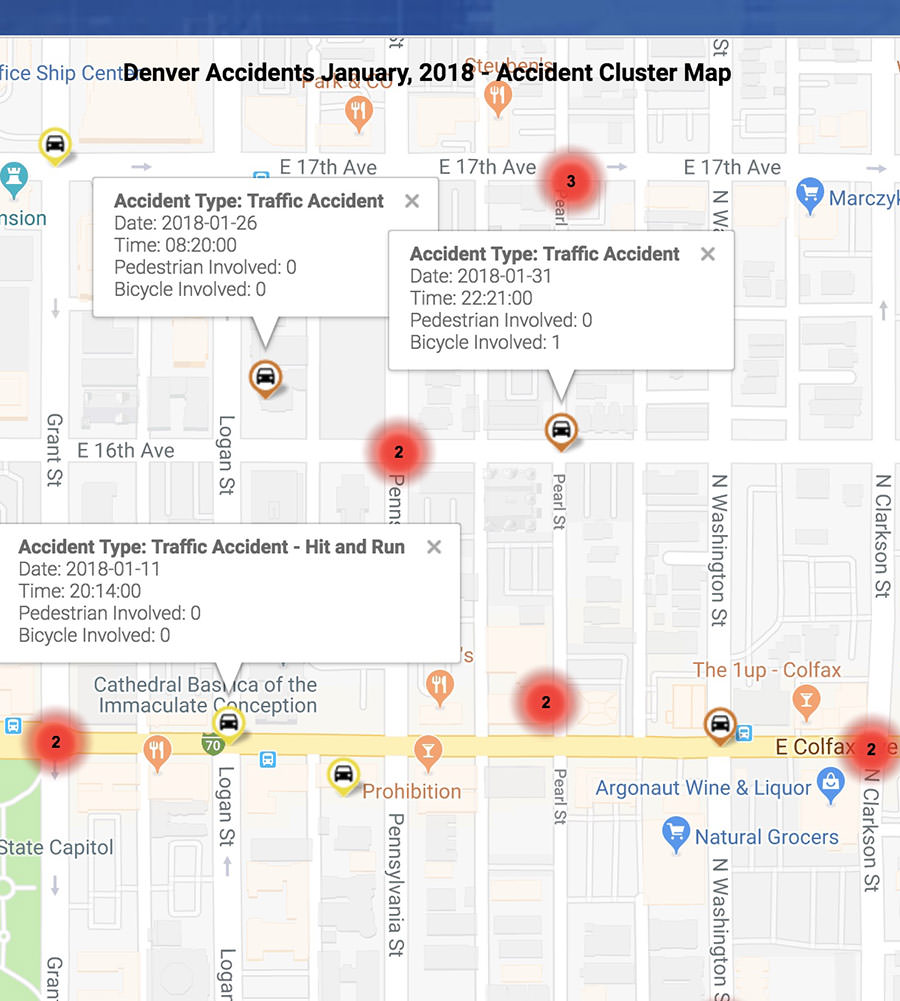
Click to enlarge
The result is a very dynamic, interactive map that allows you to drill down by month (within the last 12 months) and all the way down to the intersection closest to where you live. I’m telling you, this map is startling. For example, within days of the Denver Accident Map going live, I learned that Denver is experiencing way more hit-and-run accidents than I previously thought. And I’m a Denver personal injury attorney! I thought I was pretty dialed-in.
During our discussions about how to use and distribute this map, Andrew and I realized that it could ultimately become quite a hot commodity for local safety organizations, news media and others. To be frank, I realized that it would be easy to earn an income from this map or limit access to just a few “partners.” But those actions would go against the very nature of why we created it in the first place: I want to help Denver residents be safer and I want Denver to be a safer place to live.
So, the map is easy to use, free and accessible to all, which also maintains the philosophy behind the Open Data Movement.
Bottom line: We hope that Denver’s traffic accident data will be used to inform people and, ultimately, to make our streets safer. We hope you enjoy using it and we’d love your feedback.